- Mazzotta Rentals, Inc. Secures $160 Million Credit Facility to Accelerate Growth and Continue Fleet Expansion
- Empowering or Overshadowing? Balancing Technology and Expertise in ABL
- Empathy from the C-Suite: Michael Haddad’s Lessons Learned From His Self-Run Job Process
- Quasar Capital Welcomes Rob Hydeman as President of Business Credit
- PKF O’Connor Davies Expands Advisory Service Offerings with PKF Clear Thinking Integration
Trends of 2021 Are Here to Stay: Inflation, Labor Issues, Commodity Price Changes, Supply Chain
December 15, 2021
By Juanita Schwartzkopf
As companies and lenders evaluate performance risk and expectations for 2022, the trends previously considered to be emerging need to be considered a permanent part of the 2022 business environment. At this point, it is unrealistic to consider inflation transitory, or to believe there is a magic switch that will eliminate labor and supply chain issues.
Inflation
Both the consumer price index (“CPI”) and producer price index (“PPI”) have continued to increase in November. The 12 month change in the CPI, as reported in November 2021, was 6.8%. This is the highest level reported since prior to 2001 and is higher than the one month peak in August of 2008 of 5.6%. In fact, this level of inflation is the highest since June 1982, which is almost 40 years ago.

These impacts are most severe in the energy sector, which experienced an overall increase of 33.3%. Gasoline had a 58.1% increase and natural gas had a 25.1% increase.
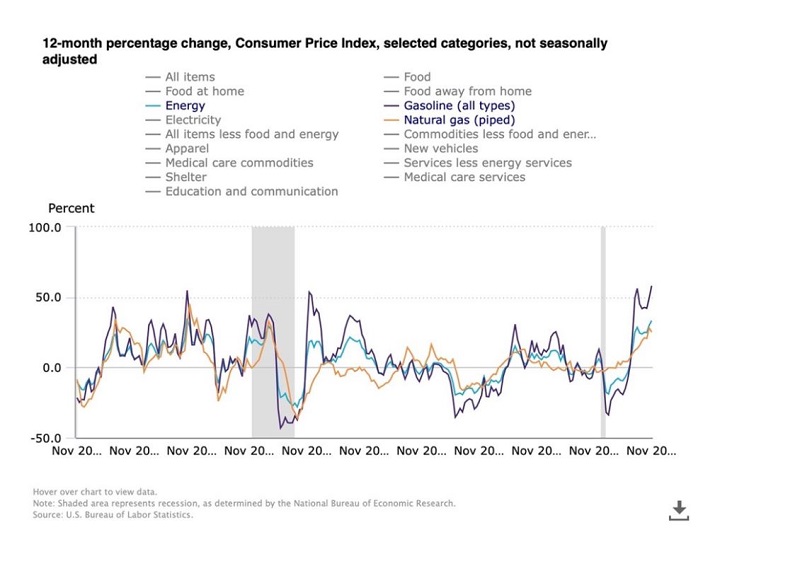
Individuals certainly feel this increase as they consider heating their homes and buying gasoline to take them to work. Companies also need to heat their facilities and purchase fuel for their vehicles.
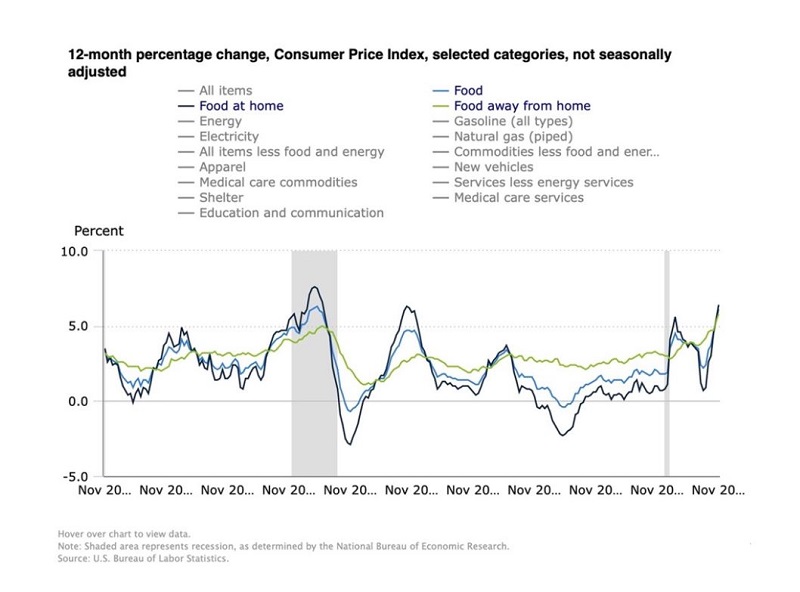
Individuals are also being significantly impacted by food price changes. Food at home increased 6.4%, food away from home increased 5.8%, and overall food increased 6.1%.
The October 2021 PPI is reported at 9.6%, which is an increase from 8.8% in October. The PPI in November is more than double the previous 10 year high of 4.5% in July and September of 2011. Until July 1978 the PPI was known as the Wholesale Price Index (“WPI”). In 1982 the Bureau of Labor Statistics reset the PPI and 1982 became the base year for reporting.
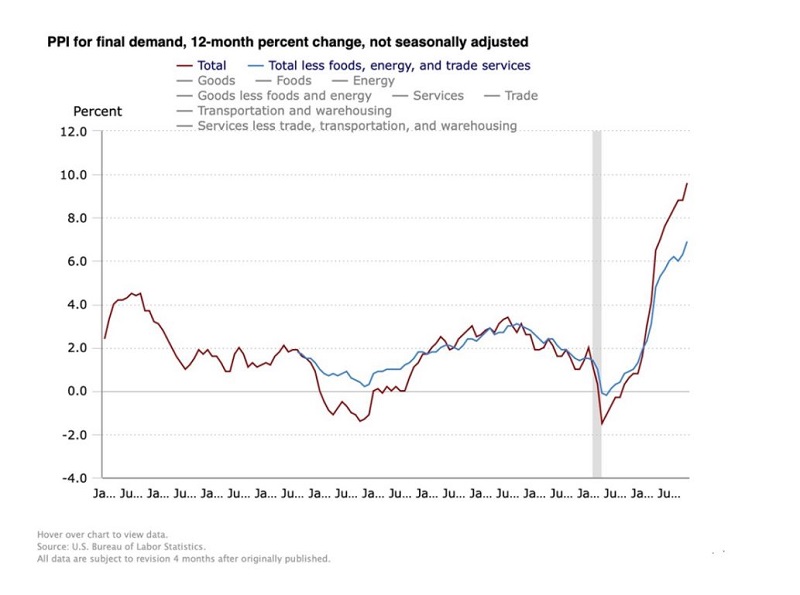
The PPI for energy in November is reported at 43.6%, and the PPI for transportation and warehousing is at 13.8%. These categories represent direct cost impacts for most businesses.
Even if the CPI and PPI begin coming down in future months, this high inflationary level is unlikely to be reduced to the extent that costs return to the previous levels. It is unreasonable to expect a period of negative price changes to offset the price growth the economy has experienced in 2021. As a result, businesses and consumers need to expect higher prices to continue and should not expect prices to return to historic levels. The percent increase may reduce but expecting a negative CPI and PPI to counteract this inflationary period should not be part of the 2022 planning process.
The Fed uses the Personal Consumption Expenditure (“PCE”) Price Index to measure inflation, in part because this index is thought to provide less volatility. The most recent reported PCE is the October 2021 index of 5.0%, which is an increase over the previous high of 4.4% in September 2021. The PCE market basket of goods is at $16,290.7 billion in November 2021, compared to the pre-Covid 19 peak of $14,769.9 billion in January of 2020.
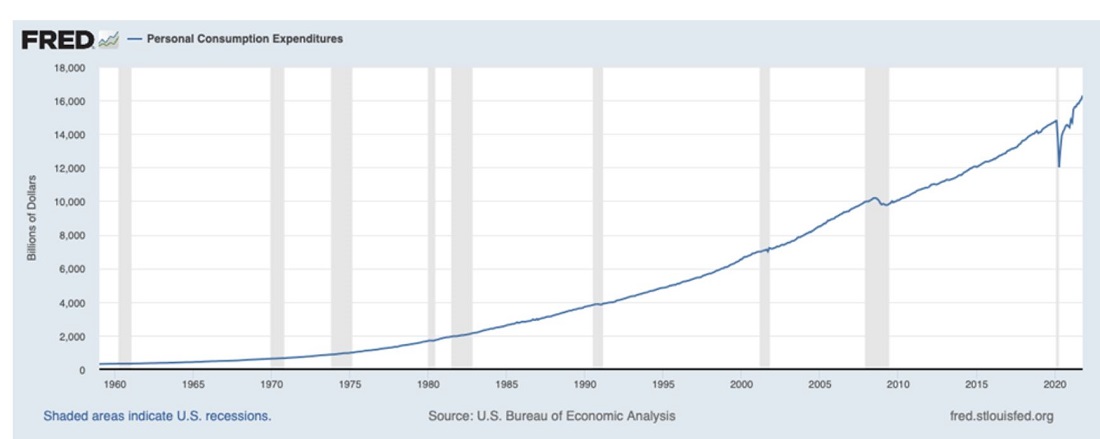
A business must consider inflation’s impact on both costs and revenues in 2022.
Labor Issues
The labor market is continuing to be problematic for businesses. The November unemployment rate was reported at 4.2%, which is a slight improvement over 4.6% in October 2021. The labor participation rate in November was 61.8%, which is also a slight improvement over 61.6% in October. The good news is that the overall labor situation did not become worse in November, but the bad news is there is a long way to go to return to the pre Covid-19 performance levels. The unemployment rate is continuing to reduce from the peak Covid-19 shut down levels. However, the labor participation rate is not increasing back to the pre-Covid-19 levels.
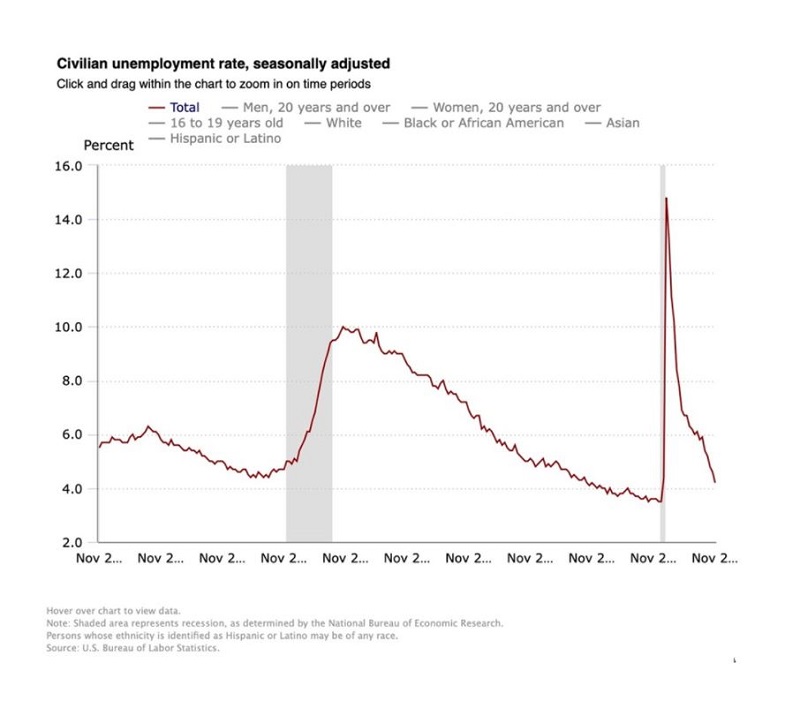

Looking at state by state unemployment the data shows the lowest unemployment rates of 1.9% in Nebraska and 2.2% in Utah, and the highest unemployment rate of 7.3% in Nevada and California. The next graphic shows unemployment rates by state.
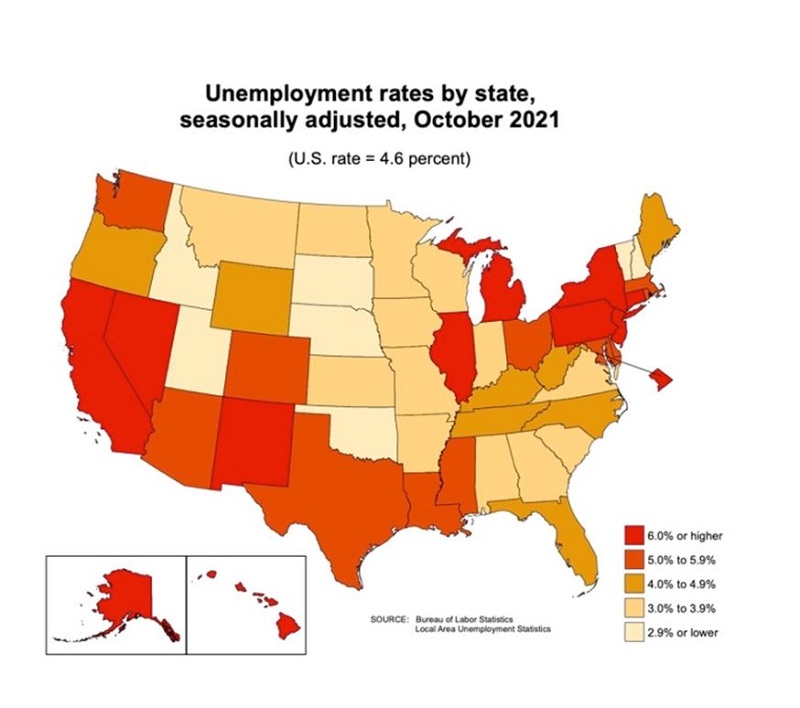
The state or region a business is operating in has a direct impact on the availability of labor and the cost of that labor. The same type of business operating in different geographic regions will have a higher or lower labor issue impact.
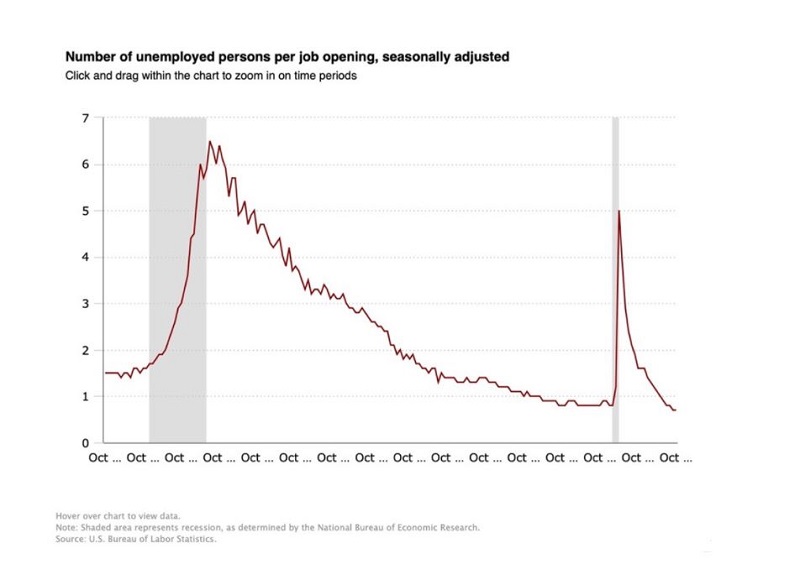
The number of unemployed persons per job opening in October was 0.7, which is the same as September. This is the lowest level since at least 2006.
Supply Chain
The Institute for Supply Management (“ISM”) reported the November 2021 Manufacturing ISM at 61.1%, which is the eighteenth consecutive month of growth. While the rate of growth had slowed to 60.8% in October, the 61.1% reported in November is an increase back to the September levels.
Some businesspeople are viewing the reporting of increased orders with a lesser increase in backlog as an early indicator that the supply chain issues are beginning to be resolved.
The November 2021 Services ISM also reported the eighteenth consecutive month of growth at 74.8%. This is the fifth record growth month recorded by this Index in 2021. The November Services ISM is an 8.1% increase over the October 2021 Services ISM of 66.7%, which was a 4.8% increase over the September 2021 Services ISM of 61.9%.
The November 2021 production materials lead time days was 96 days, which is the same as the October 2021 results, and a four day increase from the 92 days reported in September. This is the highest lead time in days since the data has been collected starting in 1987. The wait time for supplies used for maintenance, repairs, and operations (“MRO”) decreased from 45 days in both September and October to 44 days in November. The September and October MRO lead days of 45 days were the highest reported levels.
What does this mean?
These statistics show inflation, commodity price changes, labor issues and supply chain disruptions are no longer emerging trends. These are trends businesses need to be prepared to effectively manage through to ensure successful operating performance during 2022, and possibly beyond. With these trends becoming the expected reality, the tools and techniques businesses use to deal with the operating and financial stresses must become a necessary part of the analysis and planning that a successful management team employs as they plan for 2022 and beyond.
Sensitivity analysis is key. How does a $1.00 per hour change in labor costs impact profitability? How does a 1% increase in nonpayroll expenses impact profitability?
Proforma planning of cost changes is key. Increasing benefits or other techniques to entice workers to come to or stay at a company must be modeled for performance impact. Increased shipping costs need to be modeled.
Price volume variance analysis must be employed for revenue items and for key input components.
Working capital impacts must be considered. Increased inventory levels, shorter supplier terms, longer customer terms, and other accounts receivable, inventory and accounts payable changes need to be evaluated for their impact on the operating cycle and on cash flow. The availability of liquidity to support these working capital changes must be modeled to ensure lines of credit are sufficient and the capital structure is appropriate in this new environment.
Weekly cash flow modeling is key to success moving into 2022. The cost dynamics coupled with working capital impacts requires detailed cash flow modeling. This modeling also helps identify problems quickly, as weekly budget to actual reporting will show changes before the income statement or balance sheet for the month end are reported.
2022 is going to be a challenging year. The level of inflation, commodity price changes, labor issues and supply chain disruptions are more significant that most company managers have experienced during their working career. For example, with inflation at a 39 year high, the number of managers that have experienced this business dynamic is low, and a specific manager’s understanding and skills have not been tested in this economic environment.
Planning and analysis are ways to reduce performance risk and identify areas for possible improvement or change before a company drops into unsustainable performance levels. Senior management of a company needs to be considering, evaluating, and planning for these trends to continue. It appears we now know what the New Normal will look like for 2022, and it will be challenging.

